When I first started learning about cryptocurrency trading, I quickly realized that price charts looked confusing. There were red and green candles everywhere, and every trader seemed to make decisions just by looking at them. At first, I thought candlestick patterns were difficult to understand, but after spending time studying them, I discovered they are actually one of the easiest ways to understand what buyers and sellers are doing in the market.
In my experience, candlestick patterns are not magical signals that predict the future. Instead, they help me understand market psychology. They show whether buyers are becoming stronger, sellers are taking control, or the market is simply waiting for the next move. Once I learned how to read these patterns, I stopped making random trading decisions and started following the story the chart was telling.
What Are Candlestick Patterns
Candlestick patterns are visual representations of price movement during a specific period. Every candle shows four important pieces of information. These are the opening price, closing price, highest price, and lowest price.
If the closing price is higher than the opening price, the candle is usually green. This means buyers controlled the market during that period.
If the closing price is lower than the opening price, the candle is usually red. This means sellers were stronger during that period.
Each candle has two main parts. The thick section is called the body, while the thin lines above and below are called wicks or shadows. The body shows the difference between the opening and closing prices, while the wicks show how high and low the price moved before the candle closed.
Understanding these simple parts helped me build a strong foundation before moving on to more advanced trading concepts.
Why Candlestick Patterns Matter
I have learned that price does not move randomly all the time. Behind every price movement are real people buying and selling. Candlestick patterns help reveal what those traders are thinking.
Sometimes buyers push the price higher but fail to keep control before the candle closes. Other times sellers dominate early, but buyers return with strength before the session ends.
These small battles create recognizable patterns that traders have studied for many years.
Although no pattern guarantees success, combining candlestick analysis with support, resistance, trend analysis, and volume has improved my trading decisions significantly.
The Importance of Market Context
One lesson I learned the hard way is that a candlestick pattern alone is never enough.
For example, a bullish reversal pattern appearing during a strong uptrend may not be as meaningful as the same pattern forming after a long downtrend.
The location of the pattern matters just as much as the pattern itself.
Whenever I analyze charts now, I first ask myself these questions.
What is the current trend?
Is the market near an important support level?
Is the market approaching resistance?
Is trading volume increasing?
Only after answering these questions do I pay close attention to candlestick formations.
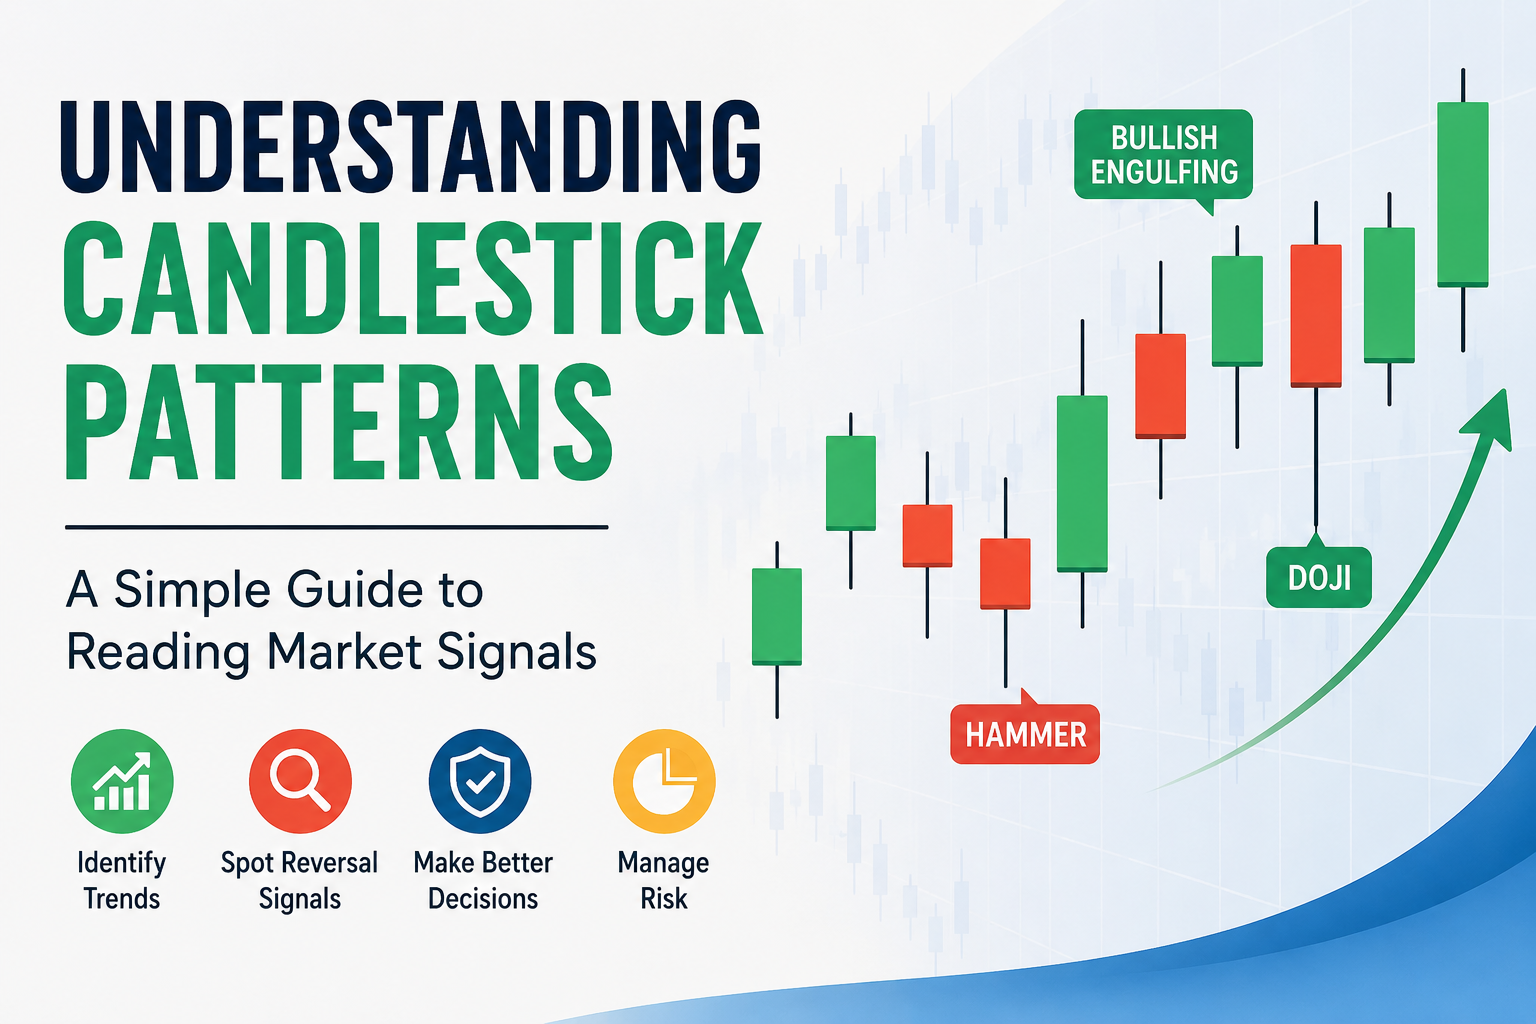
Doji Pattern
The Doji is one of the first candlestick patterns I learned.
A Doji forms when the opening and closing prices are almost the same. The body becomes very small while the wicks may be long or short.
This pattern shows hesitation in the market.
Neither buyers nor sellers were able to gain complete control.
If a Doji appears after a strong upward trend, it may suggest that buyers are losing momentum.
If it appears after a long decline, it can signal that selling pressure is weakening.
I never trade based only on a Doji, but I always pay attention because it often warns me that something important could happen next.
Hammer Pattern
The Hammer is one of my favorite bullish reversal patterns.
It has a small body near the top with a long lower wick.
This tells me sellers pushed prices much lower during the trading session, but buyers came back strongly and forced the price to close near the opening level.
Whenever I see a Hammer after a prolonged downtrend, I become interested in possible buying opportunities.
However, I still wait for confirmation from the next candle before entering a trade.
Inverted Hammer
The Inverted Hammer has a small body with a long upper wick.
It usually appears after a downtrend.
This pattern shows buyers attempted to push prices higher. Even though sellers pulled prices back before the close, the buying effort suggests momentum may be changing.
When I combine this pattern with strong support levels and increasing volume, it becomes much more reliable.
Shooting Star
The Shooting Star is basically the opposite of the Hammer.
It appears after an uptrend.
The candle has a small body near the bottom and a long upper wick.
This tells me buyers tried to continue pushing prices higher, but sellers stepped in aggressively and forced the price back down.
Whenever I notice a Shooting Star near a major resistance level, I prepare for the possibility of a market reversal.
Hanging Man
The Hanging Man looks very similar to the Hammer.
The difference is where it appears.
Instead of forming after a downtrend, it appears after an uptrend.
Even though buyers are still in control overall, the long lower wick shows sellers managed to push prices significantly lower during the session.
That warning tells me bullish momentum could be slowing.
I always wait for bearish confirmation before making any trading decision.
Bullish Engulfing Pattern
This is one of the strongest reversal signals I watch.
The pattern consists of two candles.
The first candle is bearish.
The second candle is bullish and completely covers the body of the previous bearish candle.
This shows buyers have completely taken control after sellers were previously dominant.
Whenever I find a Bullish Engulfing pattern near strong support, I pay very close attention because it often leads to meaningful upward movement.
Bearish Engulfing Pattern
The Bearish Engulfing pattern is the opposite.
The first candle is bullish.
The second candle is bearish and completely covers the body of the previous bullish candle.
This tells me sellers have overwhelmed buyers.
When I see this pattern near resistance, I become cautious about holding long positions.
Morning Star Pattern
The Morning Star is another powerful bullish reversal pattern.
It consists of three candles.
The first candle is strongly bearish.
The second candle has a small body showing hesitation.
The third candle is strongly bullish.
Together these candles tell a story.
First sellers dominate.
Then the market becomes uncertain.
Finally buyers regain control.
I like this pattern because it clearly shows momentum shifting from sellers to buyers.
Evening Star Pattern
The Evening Star works exactly opposite.
It forms after an uptrend.
The first candle is strongly bullish.
The second candle shows hesitation.
The third candle closes strongly bearish.
This combination often suggests buyers are losing strength while sellers are becoming more aggressive.
Piercing Pattern
The Piercing Pattern is another bullish reversal signal.
The first candle closes bearish.
The second candle opens lower but closes above the midpoint of the previous candle.
This tells me buyers entered the market with enough strength to recover much of the previous losses.
I often consider this a positive sign, especially after extended market declines.
Dark Cloud Cover
Dark Cloud Cover is the bearish version of the Piercing Pattern.
After a bullish candle, the next candle opens higher but closes below the midpoint of the previous bullish candle.
This tells me sellers have suddenly become much stronger.
Whenever I see this near resistance, I become more careful before entering new buy positions.
Combining Candlestick Patterns With Other Indicators
One mistake I made as a beginner was relying only on candlestick patterns.
Later I learned that successful traders combine several forms of analysis.
I usually check moving averages to understand the overall trend.
I also use the Relative Strength Index to identify whether the market may be overbought or oversold.
Volume is another important factor because strong volume often confirms the strength of a candlestick pattern.
Support and resistance levels also make a huge difference.
A Hammer appearing in the middle of nowhere means much less than a Hammer forming exactly at a major support zone.
Common Mistakes Beginners Make
Many beginners believe every candlestick pattern guarantees profit.
Unfortunately, markets are never that simple.
Sometimes perfect looking patterns fail because unexpected news changes market sentiment.
Another mistake is entering trades too early without waiting for confirmation.
I have learned that patience usually produces better results than rushing into every opportunity.
Risk management is equally important.
Even the strongest candlestick pattern can fail.
That is why I always use stop losses and never risk more money than I can comfortably afford to lose.
My Final Thoughts
Understanding candlestick patterns completely changed the way I view financial markets. Instead of guessing where prices might go, I now focus on reading the battle between buyers and sellers. Every candle tells a story, and every pattern provides valuable clues about market sentiment.
Over time, I realized that successful trading is not about memorizing dozens of patterns. It is about understanding why those patterns form and how they fit into the bigger market picture. The more charts I studied, the easier it became to recognize high quality trading opportunities while avoiding unnecessary risks.
If you are just beginning your trading journey, my advice is to practice regularly. Open historical charts, identify different candlestick patterns, and observe what happened after they appeared. This simple habit will build your confidence much faster than reading theory alone.
Candlestick patterns are powerful tools, but they work best when combined with proper risk management, trend analysis, support and resistance, and patience. As I continue learning and improving my trading skills, these patterns remain one of the most valuable parts of my trading strategy because they help me understand what the market is trying to communicate before making any decision.