If someone had asked me about crypto charts when I first started learning about cryptocurrency, I would have honestly said they looked confusing. I used to think that only professional traders could understand those colorful lines and candles moving up and down every second. After spending time learning and practicing, I realized that crypto charts are much easier to understand than they appear. The key is to learn one concept at a time and avoid rushing into trading without understanding what the chart is trying to tell you.
Reading crypto charts has become one of the most valuable skills in my trading journey. Instead of buying coins based on emotions or social media hype, I now look at the chart first. It helps me understand the market direction and gives me more confidence before making any decision.
Why Crypto Charts Matter
A crypto chart shows the price movement of a cryptocurrency over a specific period. It tells the story of buyers and sellers. Every movement on the chart happens because people are buying or selling an asset.
I always remind myself that the chart reflects market psychology. When buyers are stronger, the price usually moves higher. When sellers dominate, the price often falls. Understanding this simple idea makes reading charts much easier.
Charts also help me identify trends. Instead of guessing whether Bitcoin or another cryptocurrency might go up or down, I can study the price action and make a more informed decision.
Choosing the Right Chart
Most crypto exchanges provide different chart types, but I mainly use the candlestick chart because it offers the most useful information.
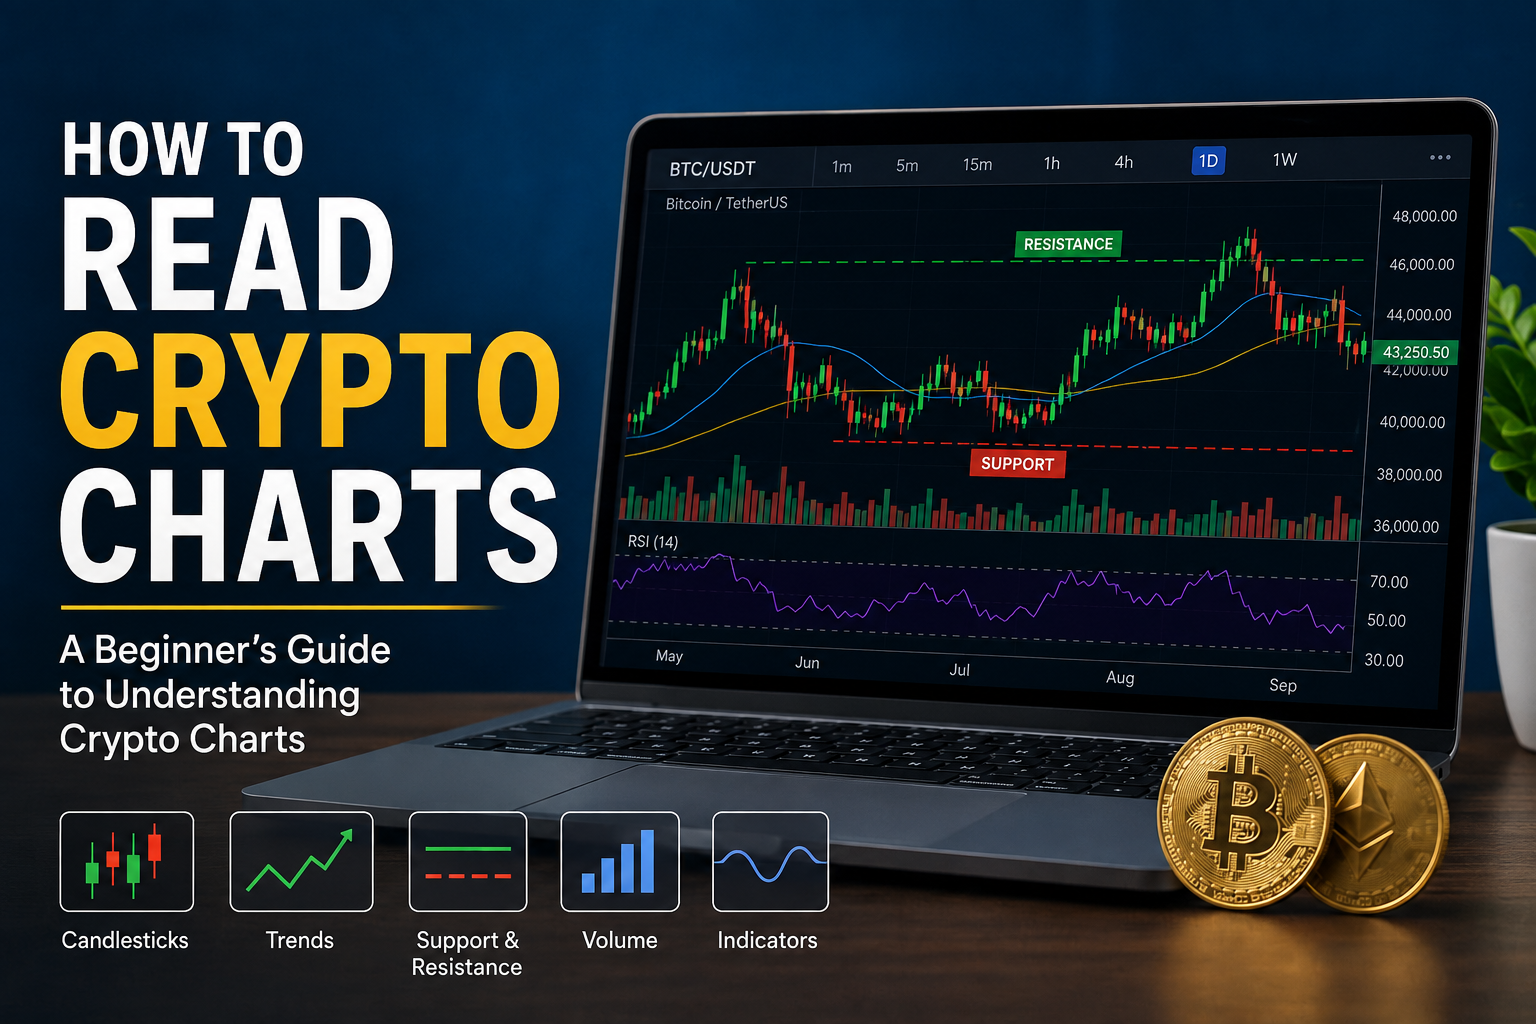
A candlestick chart displays four important values during a selected time period.
The opening price
The closing price
The highest price
The lowest price
These four values help me understand how buyers and sellers behaved during that specific time.
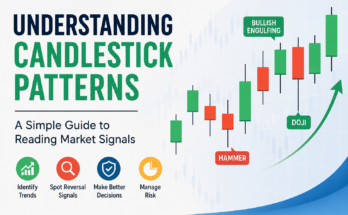
Green candles usually indicate that the price closed higher than it opened. Red candles usually indicate that the price closed lower than it opened.
Once I understood how candlesticks worked, reading crypto charts became much easier.
Understanding Time Frames
One mistake I made in the beginning was constantly switching between different time frames. Every chart looked different, and I became confused.
Later, I learned that each time frame serves a different purpose.
A one minute chart is useful for very short term traders.
A five minute or fifteen minute chart helps active day traders.
A one hour or four hour chart provides a better view of medium term trends.
A daily chart is one of my favorites because it removes a lot of market noise and gives a clearer picture.
For beginners, I believe using the four hour and daily charts is much easier than focusing on very small time frames.
Learning About Trends
The first thing I look for on any crypto chart is the trend.
An uptrend means prices continue making higher highs and higher lows.
A downtrend means prices continue making lower highs and lower lows.
A sideways trend means the price moves within a range without showing a clear direction.
I always prefer trading in the direction of the main trend because fighting against the market usually increases risk.
When I started respecting the trend instead of trying to predict reversals, my trading decisions became much better.
Support and Resistance
Support and resistance are two of the most useful concepts I have learned.
Support is an area where buyers usually become active, preventing prices from falling further.
Resistance is an area where sellers often appear, preventing prices from rising higher.
Whenever I open a chart, I immediately identify important support and resistance levels. These areas often become potential entry and exit points.
Although support and resistance are never guaranteed, they frequently influence price movements.
Understanding Trading Volume
Price alone does not tell the complete story. I also pay close attention to trading volume.
Volume shows how many coins were bought and sold during a specific period.
If the price rises with strong volume, I consider the movement more reliable.
If the price rises with very low volume, I become more cautious because the move may not last long.
Volume acts like confirmation for price action. It helps me avoid entering weak market moves.
Moving Averages
One of the first indicators I learned was the moving average.
A moving average smooths price movement and helps identify the overall trend.
Many traders use the 20 day, 50 day, and 200 day moving averages.
I personally use moving averages as guides rather than signals. If the price stays above important moving averages, I generally consider the trend healthy. If the price stays below them for a long period, I become more careful.
Indicators should never replace price action, but they can provide additional confidence.
Relative Strength Index
The Relative Strength Index, often called RSI, is another helpful indicator.
RSI measures whether a cryptocurrency may be overbought or oversold.
A high RSI does not automatically mean the price will fall, and a low RSI does not automatically mean the price will rise.
Instead, I use RSI as an additional clue while analyzing the overall chart.
Combining RSI with support, resistance, and trend analysis gives me a much stronger trading strategy.
Avoid Emotional Decisions
Perhaps the biggest lesson I learned is that charts are useful only if I stay disciplined.
Many beginners panic when prices suddenly drop or become overly excited during strong rallies.
I have experienced both situations myself.
Now I always follow my trading plan instead of reacting emotionally.
No chart can predict the future with complete accuracy, but reading charts properly helps reduce unnecessary mistakes and improves decision making over time.
Learn Common Chart Patterns
As I gained more experience, I started paying attention to chart patterns. At first they seemed difficult to recognize, but after looking at hundreds of charts, they became much easier to spot.
One common pattern is the double top. This pattern often appears after a strong upward move and may suggest that buyers are losing strength. Another popular pattern is the double bottom, which can indicate that sellers are becoming weaker and buyers may start taking control.
I also learned about triangles. Sometimes the price moves within a narrowing range before making a strong move in one direction. While no pattern guarantees what will happen next, they often help me prepare for possible market movements.
The most important thing I remind myself is not to trade simply because I see a pattern. I always look for confirmation from the trend, volume, and support or resistance levels before making a decision.
Understand Market Momentum
Momentum is another factor that I always keep in mind while reading crypto charts.
Sometimes the price is moving upward with strong energy. Buyers continue entering the market, and candles close confidently. This usually tells me that the current trend has healthy momentum.
At other times, the price may still be rising, but each candle becomes smaller and volume starts decreasing. This can be a sign that the trend is slowing down.
Learning to recognize momentum has helped me avoid entering trades when the market is losing strength.
Practice Before Trading Real Money
One mistake many beginners make is investing real money before understanding how charts work. I believe practice should always come first.
I spent time analyzing historical charts without placing trades. I looked at previous trends and tried to predict what might happen next before checking the actual result.
This simple exercise improved my confidence and helped me understand market behavior much better.
Many crypto platforms also offer demo accounts where beginners can practice without risking real funds. I think this is one of the safest ways to learn.
Manage Risk Every Time
Even the best chart analysis cannot guarantee success. The crypto market is highly volatile, and unexpected news can change prices within minutes.
Because of this, I never risk all my money on a single trade.
I always decide how much I am willing to lose before entering the market. This approach protects my trading account and allows me to continue learning even after a losing trade.
Successful trading is not about winning every trade. It is about managing losses while allowing winning trades to grow.
Common Mistakes Beginners Make
Looking back, I made several mistakes that many beginners still make today.
The first mistake was relying on emotions instead of analysis.
The second mistake was changing strategies every few days without giving myself enough time to learn.
The third mistake was ignoring risk management because I believed every trade would become profitable.
I also spent too much time watching one minute charts. Every small movement made me nervous, and I ended up making poor decisions.
Once I switched to higher time frames and focused on learning instead of chasing quick profits, my understanding improved significantly.
Build Your Own Trading Routine
Reading crypto charts becomes easier when you follow the same routine every day.
Whenever I open a chart, I begin by checking the overall trend.
Then I identify important support and resistance levels.
After that, I examine trading volume to see whether recent price movements are supported by strong buying or selling activity.
Next, I review indicators like moving averages and RSI for additional confirmation.
Finally, I decide whether the current setup matches my trading plan. If it does not, I simply wait for a better opportunity.
Having a routine keeps me disciplined and reduces emotional decisions.
Continue Learning Every Day
The crypto market changes constantly. New trends appear, market conditions shift, and different cryptocurrencies behave differently.
Because of this, I believe learning should never stop.
I regularly study charts from Bitcoin, Ethereum, and other major cryptocurrencies. Even if I do not plan to trade them, they provide valuable lessons about market psychology and price behavior.
Reading books, watching educational videos, and reviewing previous trades have all helped me become a better chart reader.
The more time I spend analyzing charts, the more confident I become.
Final Thoughts
Learning how to read crypto charts completely changed the way I approach cryptocurrency investing. Instead of depending on rumors, social media posts, or random predictions, I now rely on chart analysis to make informed decisions.
I believe every beginner can learn this skill with patience and consistent practice. No one becomes an expert overnight, and that is perfectly normal. The important thing is to keep learning, study one concept at a time, and avoid rushing into trades without understanding the market.
Crypto charts are not magical tools that predict the future, but they provide valuable information about price movement, market sentiment, and trading opportunities. By understanding candlesticks, trends, support and resistance, volume, moving averages, RSI, and chart patterns, anyone can build a strong foundation for smarter trading.
In my experience, success comes from discipline rather than luck. I continue practicing, reviewing my mistakes, and improving my strategy every day. If you stay patient, focus on learning, and manage your risk wisely, reading crypto charts will gradually become second nature. Over time, you will make better decisions, avoid unnecessary mistakes, and gain the confidence needed to navigate the exciting world of cryptocurrency trading.